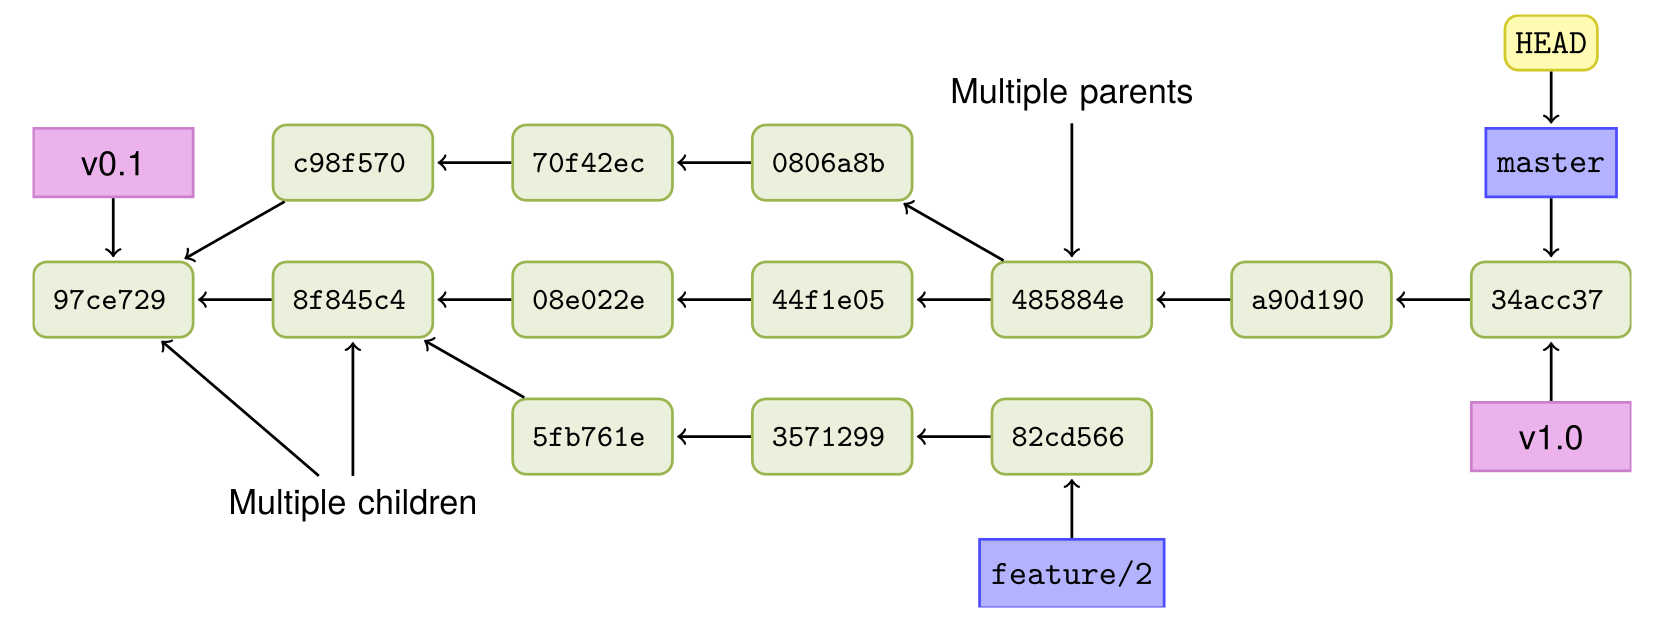
The history in Git is formed from the commit objects; as development advances, branches are created and merged, and the history will create a directed acyclic graph, the DAG, because of the way that Git ties a commit to its parent commit. The DAG makes it easy to see the development of a project based on the commits.
A graph of the example repository with abbreviated commit IDs
You can view the history (the DAG) in Git by using its git log command. There are also a number of visual Git tools that can graphically display the history.
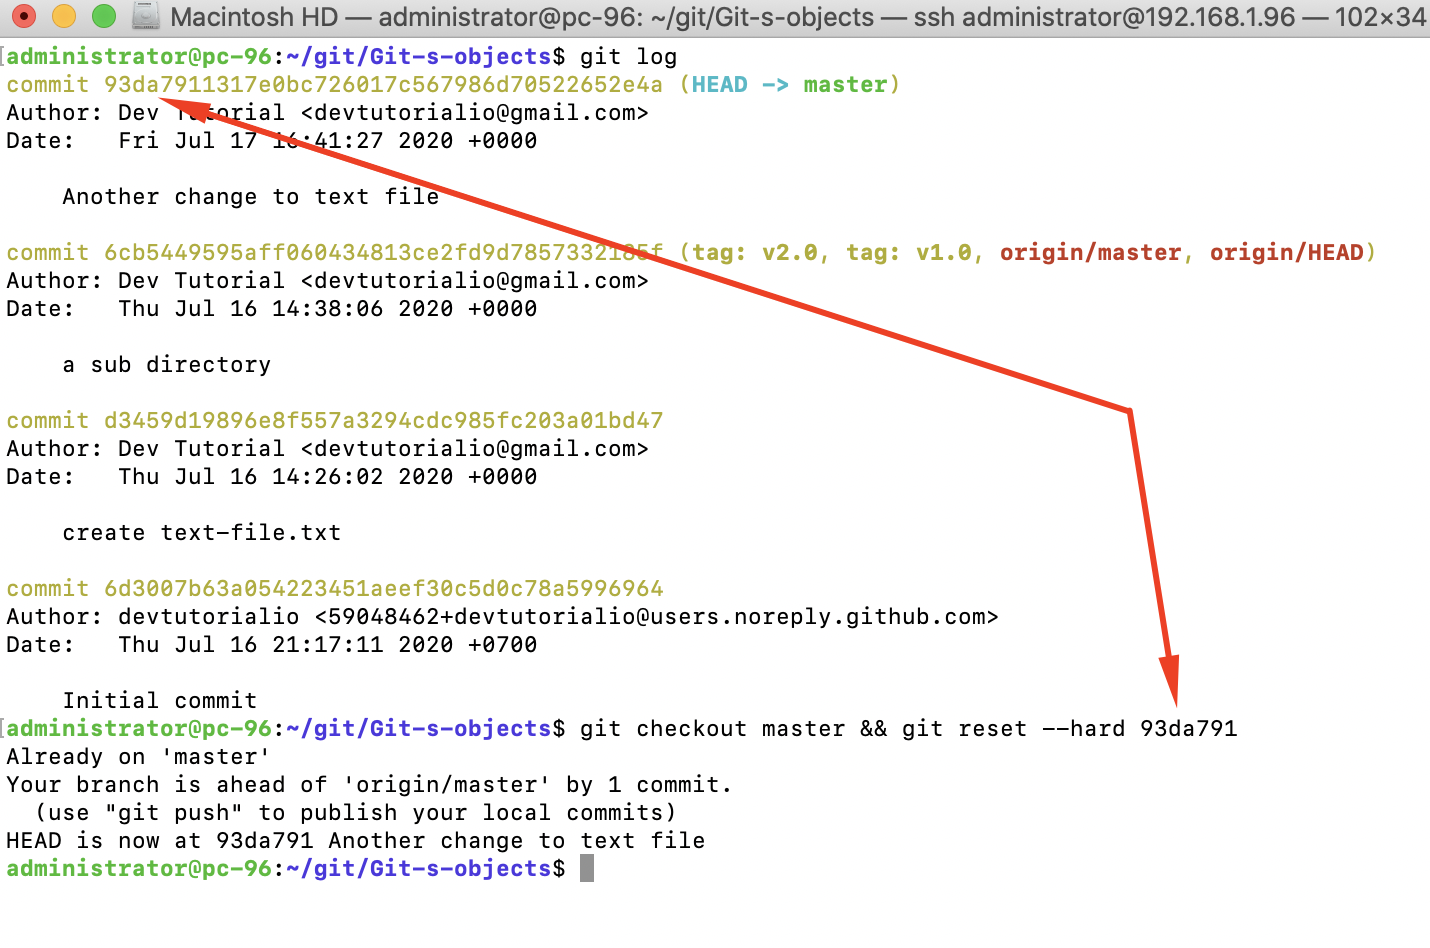
We will use the example repository from the last section and ensure that the master branch is pointing to 93da791:
we only use the first seven characters (34acc37) of the commit ID; this is fine as long as the abbreviated ID that is used is unique in the repository.
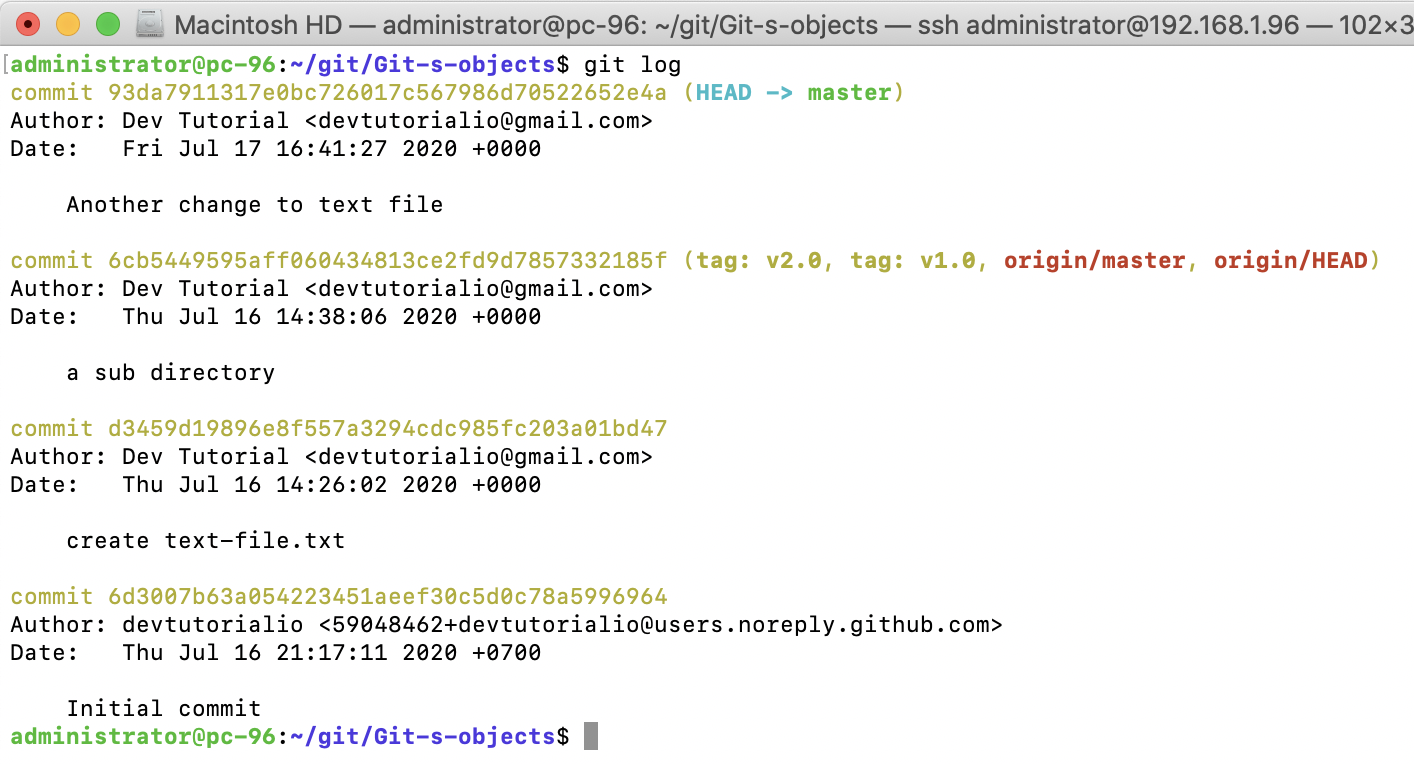
The simplest way to see the history is to use the git log command; this will display the history in reverse chronological order. The output is paged through less and can be further limited, for example, by providing only the number of commits in the history to be displayed:
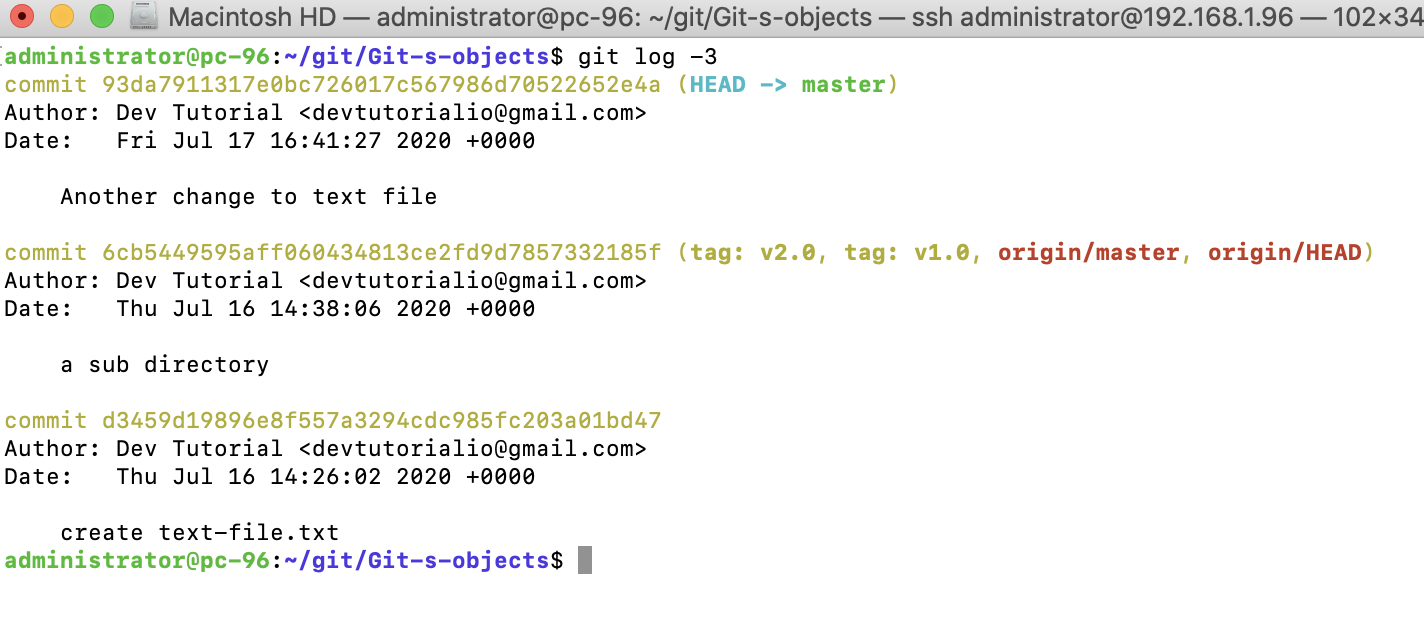
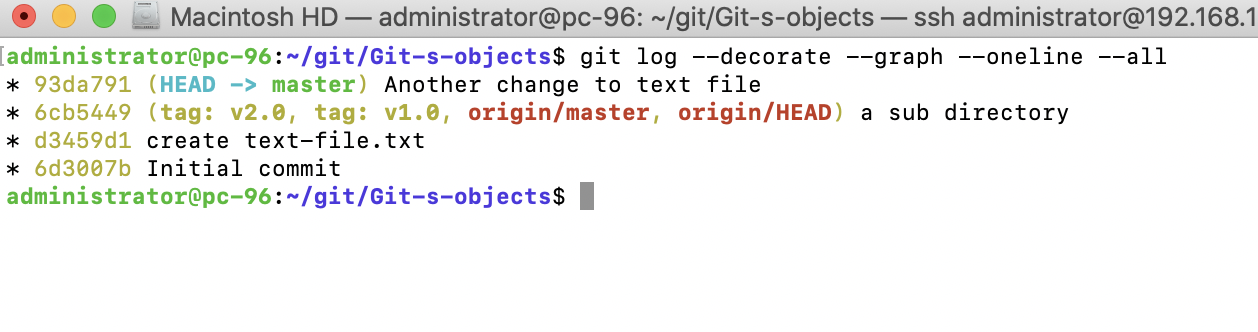
By default, git log prints the commit, author's name and email ID, timestamp, and the commit message. However, the information isn't very graphical, especially if you want to see branches and merges. To display this information and limit some of the other data, you can use the following options with git log:
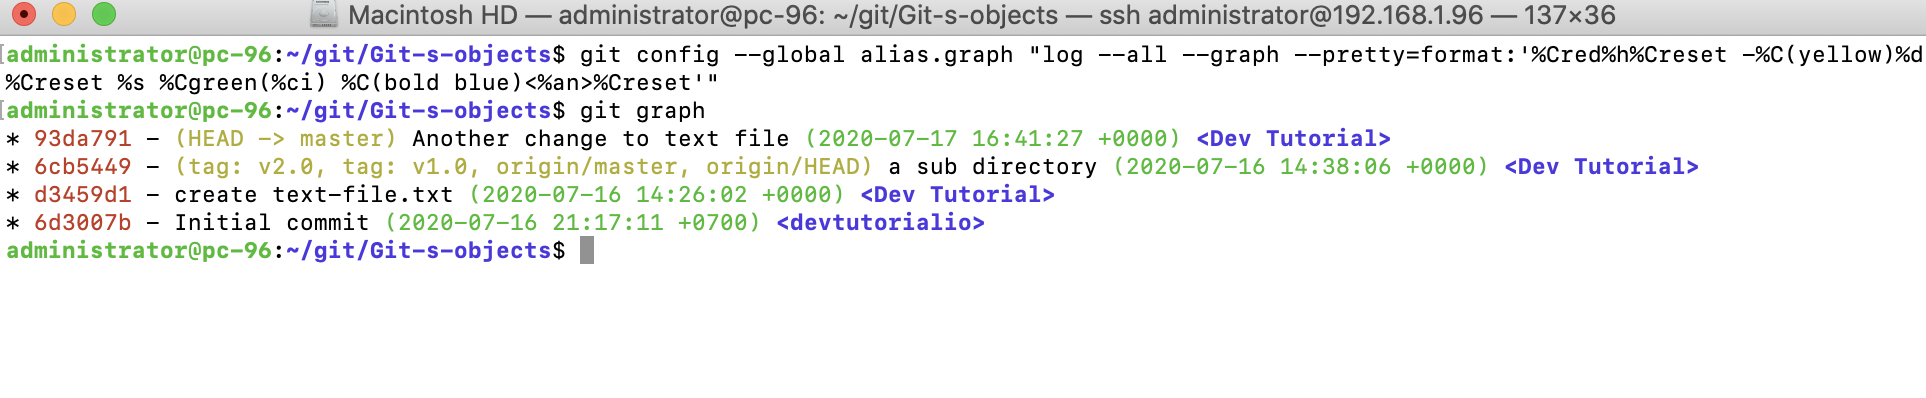
Fortunately, the log command gives us the ability to create our own output format. So, we can make a history view similar to the previous one. The colors are made with the %C<color-name>text-be-colored%Creset syntax, along with the author and timestamp information and some colors to display it nicely
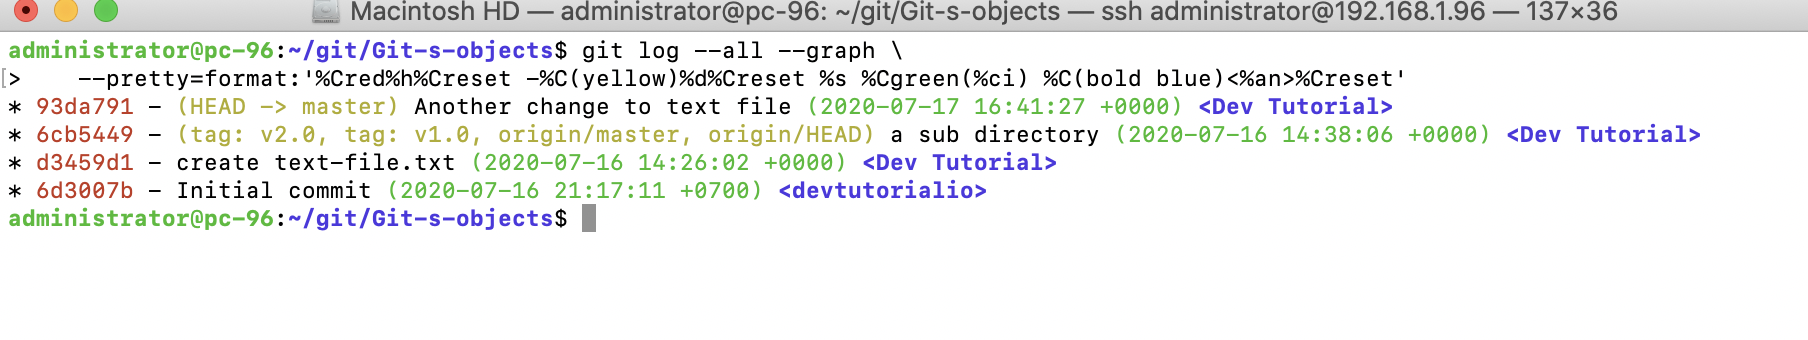
it can be made as an alias so you only have to write it once:
Now, all you need to do is call git graph to show the history